To celebrate Earth Day this year, Val and I would like to congratulate the winners of a friendly competition to build the best open source software for monitoring, understanding, and connecting with the Salish Sea ecosystem. We think the future looks bright for technological innovations that can leverage the increasingly open sharing of data and software in Puget Sound and across the range of the endangered Southern Resident killer whales (SRKWs).
The informal competition is called OrcaViz and showcases the most innovative and intriguing new visualizations from the Orcasound open source software design and development community — a group of volunteers working with ~20 NGOs in Washington State that are members of the Orcasound hydrophone network. We continue to be extremely impressed with the conservation science advancements provided through open source software communities, whether through intermittent hackathons like those run by Democracy Lab or Microsoft, or through steady asynchronous contributions from coders around the world who are inspired to help endangered orcas and other imperiled species.
The 2023 winner of Best Visualization of Ecosystem Data is Zoe Liu, a data scientist and biostatistician based in Minnesota and a long-term volunteer with Orcasound and the Acartia.io data cooperative. You can explore the orca-salmon dashboard that she created now (a Dash web app with Plotly interactive charts, see screenshot!), or read more about the project below.
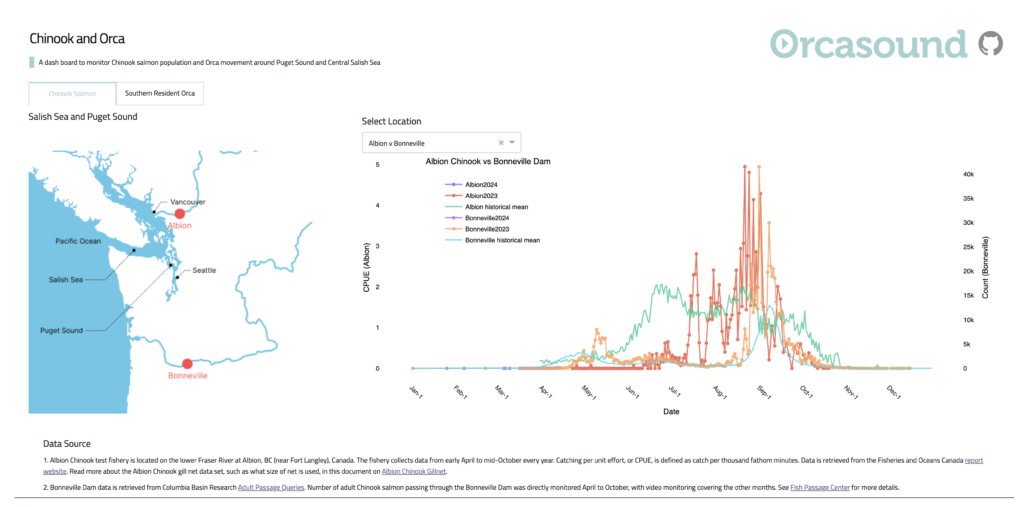
Zoe developed a new Python-based web app that automates the process of scraping salmon monitoring data from two public sources — a process previously conducted manually by me painstakingly copying from PDFs or tabulated data within web sites. Every Tuesday night, Zoe’s scripts run automatically via Github Actions within the public repository — https://github.com/salish-sea/orca-salmon. They acquire and archive the latest observations of returning adult Chinook salmon — the favorite food of our endangered orcas — from both the Canadian test fishery at Albion on the Fraser River and the fish counters at the Boneville dam on the Columbia River. Then Zoe’s app displays the new salmon abundance (or CPUE = Catch Per Unit Effort) estimates as a time series juxtaposed with data from the previous two years, as well as the historic mean curves.
This default view of the orca-salmon dashboard is a great way to track in real time the big salmon of interest to the endangered SRKWs. We review it during the weekly Orcasound stand-up meetings on Wednesday mornings and find that it helps us contextualize the movements of SRKWs as we observe them through the seasons and from day-to-day — based primarily on acoustic observations from Orcasound’s human or machine listeners, and/or on visual observations from our partner sighting networks — especially those facilitated on Facebook by Orca Network and the Orca Behavior Institute:
- Orca Network daily sightings Facebook page
- Whale Sightings in the San Juans Facebook page (organized by the Orca Behavior Institute)
Zoe leveraged the availability of many of these acoustic and visual observations via the Acartia data cooperatives open API to create a second “tab” in the orca-salmon dashboard (see screenshot). Not only does she filter the API response to extract only the SRKW observations, but she also searches the comment field to associate the location datum with the SRKW pod – J, K, or L. Thus, she has created not only a new tool for looking for correlations between orca occupancy metrics and returning salmon estimates (the scatter plots on the right, echoing Ford et al., 2005), but also an independently-valuable map interface for exploring the movement patterns of reach SRKW pod!
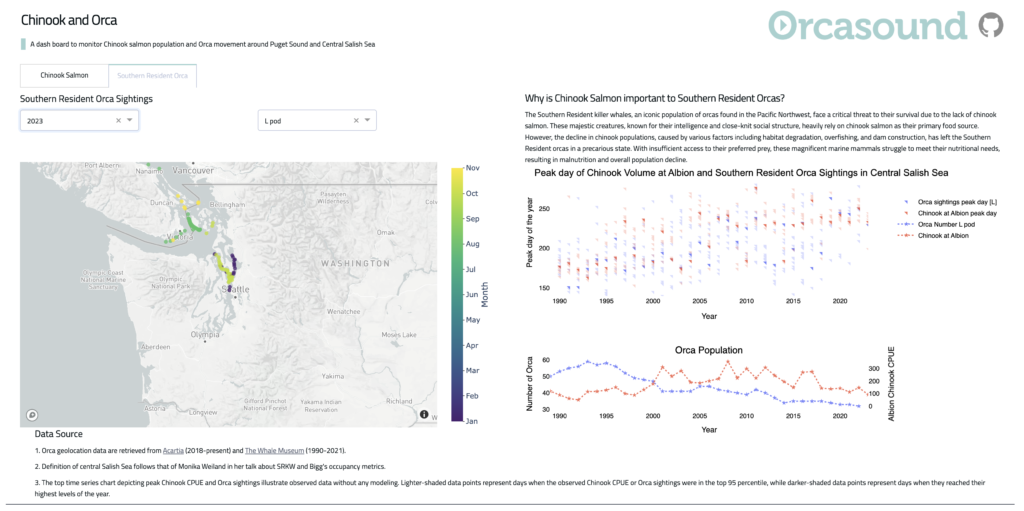
Once you’ve selected the “Southern Resident Orca” tab in the dashboard, try using both the year filter and the pod filter. It’s an exciting new way to review recent and historic orca movements (SRKW phenology by pod!). As an aside, this is a first public tool that quantifies orca occupancy metrics — a goal for a new indicator for orcas within the Puget Sound Vital Sign. In this case, Zoe is filtering geographically to seek a peak number of sightings within the “central Salish Sea” (as defined by Monika Wieland Shields).
We say “CONGRATS” and “Thank You” to Zoe and the many other Orcasound volunteers who are helping build better tools for science and conservation. And we look forward to further improvements (from you!?) to such free and open source innovations. Feel free to provide feedback as you experiment with the dashboard via issues within the public orca-salmon software repository.